
Looking back at the first three months of the year, the number of historical events we have just experienced is simply mind-boggling. Which is somewhat difficult to comprehend. Because on a daily basis, the physical world with which we interact has shrunk dramatically. No doubt, historians will fill volumes with what we just lived through. This article will take a look at the most recent bear market–what we just went through, where we are now at, whether we just saw the bottom, and what we should be on the lookout for.
Wait, What Just Happened?
If I had only have one word to describe markets during March, what would it be? Volatile. If you remember back to the March Market Update, we discussed market volatility. And how once volatility surpasses a certain level, volatility begets more volatility. It begins to cluster, even spreading from one asset class to another.
In February, we started to see volatility pick-up in the oil markets. By early March, volatility began to increase in the equity markets. It then spread to gold and treasuries. As I outlined in one of my March email updates, this was especially concerning. In times of panic, investors consider gold a safe-haven. And Treasuries are believed to be one of the closest thing to risk-free that you can get. But neither were behaving as they should, signaling something significant—liquidity was freezing up.
Bazookas, Tanks, and Nukes

In the midst of the Global Financial Crisis (GFC), Treasury Secretary Hank Paulson famously said, “If you’ve got a bazooka, and people know you’ve got it, you may not have to take it out.” Not wanting to repeat the mistakes made in the GFC, the Federal Reserve decided to act aggressively.
On March 3rd, the Fed fired its first bazooka by slashing the Fed Funds rate by ½%. Sunday, March 15th, it fired another. It took interest rates down to zero. For good measure, it fired a third by saying that it would keep interest rates near zero for the foreseeable future.
By mid-March, many market watchers assumed the Fed had fired all of its ammo. But the Fed came out the next week and fired about 5 to 10 more bazookas, saying it would buy $500B of Treasury securities and at least $200B of mortgage securities.
In a continued display of its firepower on March 23rd, the Fed fired off a Howitzer tank when it would purchase investment-grade corporate debt and municipal bonds. On April 9th, the Fed made good on the statement that it would do whatever it take to support the financial markets. It was on that day the Federal Reserve detonated a nuke. It announced that it would be buying junk bonds. Junk bonds are simply corporate debt that has a higher risk of default. Said in another way, it is riskier. Usually, these are companies that are financially struggling.
A Quick History Lesson
James Pierpont (J.P.) Morgan and other bankers used their personal funds to help the country through the Panic of 1907. After doing so, J.P. Morgan insisted that the government create a central bank to deal with future financial crises. Part of his rationale was that the U.S. was no longer an emerging country. Several years later, Congress passed the 1913 Federal Reserve Act—legislation that created the current Federal Reserve System.

During the Great Depression, Congress passed what became section 13(3)—the Emergency Relief and Construction Act of 1932. This act allowed advances to member banks in “exceptional and exigent circumstances.”
It wouldn’t be until 2008 that we would see article 13(3) come back into play. At that time, the Fed took on the role of “lender of last resort.” It bailed out AIG, Bear Stearns, Citigroup, and Bank of America. At the time, the action was controversial. It raised several important policy issues around whether companies were truly too big to fail.
On March 23rd, we saw article 13(3) come back into play. The biggest problem with the Fed’s plan to buy investment-grade corporate bonds, municipal bonds, and junk bonds is that its mandate does not explicitly allow it to hold those items on its balance sheet. If that is the case, how is the Fed able to do this?
Making Sausage
To facilitate the purchase of corporate debt, the Fed created a Special Purpose Vehicle (SPV). This vehicle is not on the Fed’s balance sheet, but on the U.S. Treasury Department’s balance sheet. Thus the Treasury Department will ultimately be responsible for running the SPV. The Secretary of the Treasury, Steven Mnuchin has enlisted BlackRock as the investment manager and adviser. BlackRockfor is a global investment management firm best know for its iShares line of exchange-traded funds (ETFs).
To purchase the debt, the Fed provides funds to the SPV. Blackrock then uses the Fed provided funds to buy corporate debt (investment grade and junk). Blackrock accomplished this by purchasing corporate debt ETFs. Coincidentally, the two largest investment-grade and junk bond ETFs are the iShares Investment Grade Corporate Bond Fund (LQD) and the iShares High Yield Corporate Bond Fund (HYG).
Something to Think About
This raises several questions related to risk? By purchasing these bonds, the government has protected bondholders from having to take losses. If the government will backstop any and every investment, does that create a moral hazard? If so, will this lead investors to take unnecessary risks—knowing that the Fed is there to protect them from losses?

Here is something else to think about. The government now owns part of the business. Let’s assume that one or two of the junk bonds defaults? Who gets saddled with the losses? Should taxpayers have to assume the losses instead of bondholders? The government will have a powerful incentive not to lose taxpayer money. How much say will the government have over what these private companies do?
Finally, there are serious questions about the legality of what just occurred. Did the Fed just overstep its mandate? If the Treasury is responsible for administering the SPV, is the Fed genuinely independent? Or is the executive branch effectively operating the Fed? But the biggest question may be the following. Now that the Fed has crossed this line, is there anything to keep them from the outright purchase of U.S. equities to prop up the stock market?
Fiscal Policy Response
Everything discussed up to this point would be considered monetary policy. In addition to the steps taken by the Fed, Congress and the President also passed a $2 trillion economic relief package—the CARES Act. It was the third phase of relief that Congress passed. Congress is contemplating adding $250 billion in funding for small businesses as the original funds have already been exhausted. Remember, none of these actions in and of themselves are considered stimulatory. They simply provide relief from the economic impact of the Coronavirus. But there is also talk of Phase 4, which would include $1 trillion for infrastructure projects.
Where Are We at Right Now?
Now that you have the full scope of the extraordinary steps taken by policymakers, let’s look at what elicited such response.
Economics of a Sudden Stop
As of February 2020, service-providing businesses employed 71% of Americans. Given that stat, it is easier to understand why it would be problematic if most people are required to stay at home—especially for those businesses that are reliant on physical foot traffic. They are seeing business come to a total halt. In March, retail sales fell by a record of -8.7%. The drop, put into proper context, is twice the biggest fall registered during the Global Financial Crisis. The April number will be much worse.
But what does this look like when it comes to a business’s actual daily revenue? Daily, local restaurants are seeing more than a 50% drop. Travel and Tourism are seeing drops over 70%.
Off the Charts
What happens when a business has a significant reduction in revenue? They must make a considerable reduction in expenses. And that is what we have seen for the past month in the weekly initial unemployment claims. Note in the chart below how the size of claims—17 million from the week of March 21st to April 4th—massively distorts the scale. If you add the last three weeks of claims to the latest unemployment rate, we are probably looking at a number above 13%—the highest since the Great Depression. Unfortunately, it appears that these claims will continue to rise as state governments struggle to timely process the influx of new applications. If there is good news on this front, it is that the largest of the weekly job losses probably happened in the last week of March.

You’re Fired
It is never good when someone loses their job. But there may be one silver lining when comparing this unemployment cycle to the Great Financial Crisis (GFC). It is how companies are laying people off. During the GFC, companies laid-off workers but faced significant issues when it came time to re-hire. To avoid repeating this past mistake, many U.S. companies have looked to Europe. As a result, many U.S. companies are now furloughing employees. These companies are continuing to provide their former employees healthcare benefits while they are unemployed. The hope is that they will be able to re-hire them quickly when the economy normalizes.
An Alphabet Soup of V’s, U’s, W’s, L’s and Y’s
Exactly when will things get back to normal? As little as a month ago, many economists were expecting a sharp drop and then a corresponding sharp recovery much like that of the letter “V.” As the impact of the Coronavirus spread, they have changed their opinion.

But what if the economy remains shut longer than expected? But when it does open, it takes off sharply. That would be a “U” shaped recovery. What if we open the economy and then have to shut it down again? That’s the “W” recovery. As we pointed out in our March Market Update, the economy was already beginning to slow in February. The Coronavirus only accelerated that. So maybe the best letter is “Y”—an initial slowing, followed by a sharp decline and rebound, and then a slow recovery.
Was that the Bottom?
If you look at the history of bear markets, the market tends to bottom approximately three to six months before the economy improves. With the market rallying almost 30% since March 23rd, it appears that the market is expecting a “U” shaped recovery, with the economy getting back on track by the end of 2020.
A Market Disconnect?
One of the most significant issues that we have right now is a lack of visibility when it comes to company earnings. This week starts the first week of the earnings season, which captures activity during the first three months of the year. Given the current uncertainty in the economy, most companies are now withdrawing earnings guidance for the remainder of the year. The big question is, can you accurately value the price of a company if you don’t know what they will earn. For the moment, the stock market seems to be looking past the next two quarters of earnings.
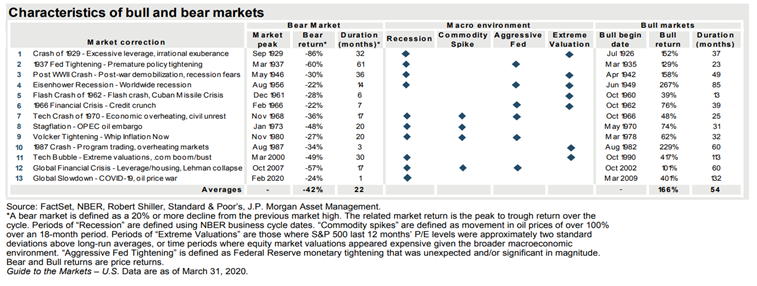
Just the Facts
A bear market is typically defined as a drop in markets in excess of 20%. If we look at the history of bear markets (below), we note that the average duration is 22 months. You will notice that those bear markets that were not accompanied by a recession recovered much more quickly. But as we pointed out earlier, that will not be the case this go-round. Many economists and market watchers are now predicting that we will experience our worst recession since the Great Depression. I think it is wishful thinking to assume that we can quickly return from this level of financial destruction.
Market Bottom or Bear Market Bounce?
So, the question I hear people continually ask is “where is the bottom?” Or “was that the bottom?” I think that those who ask these questions are starting with the wrong initial assumption—that bottoms are based on a single point such as price. But what if a market bottom is not a point but a process?
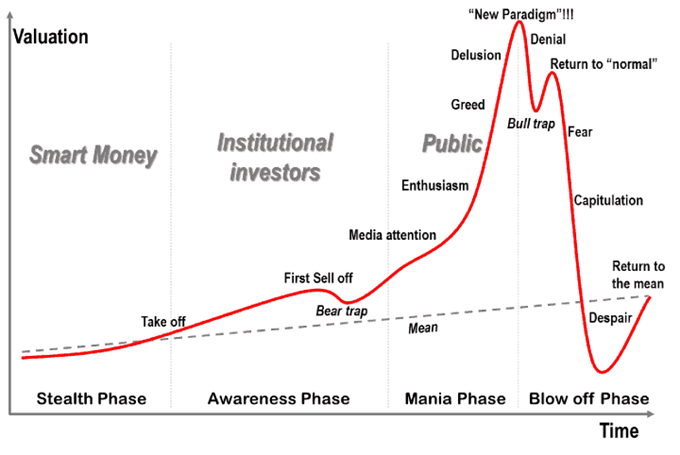
Tiny Bubbles
One of the best charts that cover the business cycle is a chart by Jean-Paul Rodrigue of Hofstra University titled the “Phases of a Bubble” (following page). Yes. I did use the word bubble. In our February Market Update, we discussed how investor optimism was at one of the most extreme levels that is has been in the last 20 years. In hindsight, it looks like there was a corporate debt bubble. Over the past 13 years, corporate debt has increased by $6.6 trillion, while cash positions increased by $1.7 trillion. A large portion of that deficit was used to finance stock buybacks.
The Best Asset to Have Right Now?
The pertinent question now is, where are we at in the cycle? There are two likely options—either return to the mean or return to “normal.” I will be the first to admit that I don’t know for sure. History says one thing, but the stock market is currently saying another. When there is such a disconnect, I have found that patience is one of the best assets you can have. Stick to your process
FOMO? What to Watch For
Almost as powerful as the fear of loss is the fear of missing out. If bottoming is a process, there are multiple points that we should be watching. Here are a few of them.

Medical Advances
When we reopen the economy, testing will be of utmost importance. Until we can do large scale testing, people can’t go back to work without running the risk of infection (possibly reinfection) and having to shut everything down again.
To truly bring this to an end, there must be a vaccine. Although there are more than 70 vaccines currently being developed, it appears that they may still be 12 to 18 months away.
Without either one of these advances, it is impossible to have any confidence as to when the economy may be able to reopen, and the economic conditions begin to improve.
Declining Volatility
As we have repeated at length, volatility begets more volatility. Until it gets to a more manageable level for the market as a whole (VIX index below 31), we are going to experience wild daily swings. I don’t know when this will happen. However, the creator of the Volatility index, Robert Whaley, expects that the VIX will be back in the 30s by August.
Link to CBOE Volatility Index
Please read these next words very carefully. Although volatility in the market may be high, it is entirely possible for improvement in certain market sectors. This goes back to the whole idea that bottoming is a process, not a single point in time. We will see improvements in certain areas and eventually that will spread into other areas.
Number of Stocks Above the 200 Day Moving Average
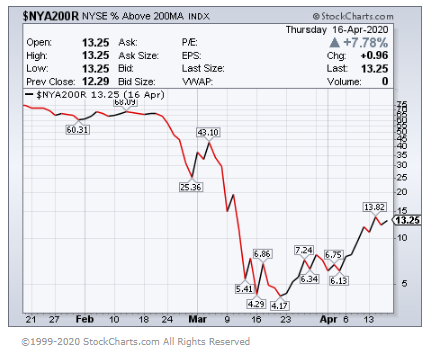
Almost 2,800 companies trade on the New York Stock Exchange. One thing to keep an eye on is what percentage of stocks are participating in market moves—also known as market breadth. The more stocks that participate in the move, the more confidence we can have that the move is sustainable. If we are in the process of making a bottom, the $NYA200R is index can give you an indication. It shows how many stocks are participating in the move by tracking the percent of stocks above their 200 day moving average. When the level is above 50%, the bias is bullish. Below 50%, the bias is bearish.
During the Global Financial Crisis, part of the bottoming process involved at least 15% of stocks trading above their 200 day moving average. Remember, no data point in and of itself should be considered an all-clear signal. But it is one data point that should be taken into consideration.
The Price of Oil
Over the last couple of weeks, the oil market has probably been the one market most disconnected from the equity markets. But I think there is still quite a bit that we can take away from what is currently happening with the price of oil.
The Worldwide Perspective
First, the price of oil may give us an indication of future economic growth prospects. Recently, the Organization of Petroleum Exporting Countries (OPEC) and non-OPEC countries agreed to cut the amount of oil being produced daily by 10 million barrels for the next two months. When the news was first reported, the price of oil rallied by almost 40% in two days. But since that time, it has lost all those gains. Could it be that the oil market is telling us that the expected demand won’t surpass even the reduced supply? Implying that the oil markets are not expecting a quick recovery for the economy.
The Local Impact
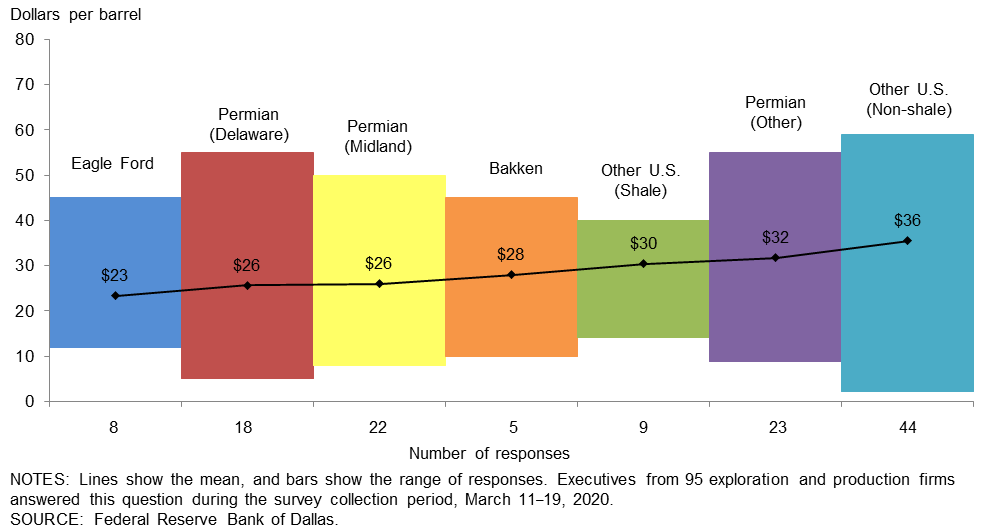
Another reason to keep an eye on the price of oil is because of the impact it has on local economies. Texas is one such economy. It relies on the oil and gas industry for jobs as well as tax revenue. The latest survey from the Dallas Federal Reserve indicated that for explorers and producers to service wells, the price of oil needs to be at around $30 per barrel. And the price would need to be higher than $50 per barrel To justify the drilling of new wells.
Without a significant increase in the price of oil, we are looking at additional unemployment and the possibility of many of the overleveraged energy companies going bankrupt. Unfortunately, when loan defaults begin to occur, you always risk the possibility of the contagion impacting other industries.
Conclusion
As we mentioned before, bottoms are a process not necessarily a point in time. Often that process is messy. For that reason, it is important not to focus on just one point, such as price, to make investment decisions. To the extent possible, remove emotions from your decision making. I have found that one of the biggest sources of emotional angst can be financial television. Keep in mind that their objectives more than likely do not match yours. Their main goal is to sell air time to advertisers.
Finally, it is important not to get locked into a narrative. John Maynard Keynes is often quoted as saying, “When the facts change, I change my mind. What do you?” At some point, things will improve. Although these times are challenging, I still have hope. Our society as a whole is learning many valuable lessons. Ones that can leave an impact for generations to come. Although painful now, I believe that these experiences can be the catalyst for change, which will benefit our country for generations to come.
Click here to learn more about how Hedgefield Wealth Management can help to remove the burden of managing your wealth.
Hedgefield Wealth Management is a registered investment adviser. Hedgefield Wealth Management does not offer legal or tax advice. Please consult the appropriate professional regarding your individual circumstance. Information presented is for educational purposes only and does not intend to make an offer or solicitation for the sale or purchase of any specific securities, investments, or investment strategies. Investments involve risk and, unless otherwise stated, are not guaranteed. Be sure to first consult with a qualified financial adviser and/or tax professional before implementing any strategy discussed herein. Past performance is not indicative of future performance.
Sources:
https://fred.stlouisfed.org/graph/fredgraph.png?g=qG3F
https://www.bls.gov/news.release/empsit.t17.htm
https://www.cnbc.com/2020/04/15/us-retail-sales-march-2020.html
https://www.ft.com/content/a74069ef-fa9e-4d27-adf8-3d679cc70512?lis
https://www.dallasfed.org/research/surveys/des/2020/2001.aspx
Hedgefield Wealth Management is a registered investment adviser. Hedgefield Wealth Management does not offer legal or tax advice. Please consult the appropriate professional regarding your individual circumstance. Information presented is for educational purposes only and does not intend to make an offer or solicitation for the sale or purchase of any specific securities, investments, or investment strategies. Investments involve risk and, unless otherwise stated, are not guaranteed. Be sure to first consult with a qualified financial adviser and/or tax professional before implementing any strategy discussed herein. Past performance is not indicative of future performance.


